Post Mortem: What Happened on Base on June 25, 2026
Post Mortem: What Happened on Base on June 25, 2026
On 25 June 2026, the Base network stopped producing blocks. Production halted at block 47806542 at 15:47 UTC and did not durably resume for close to two hours, with a shorter recurrence the following afternoon. This is a different kind of event from the Base incident we examined last August, and the difference is the part worth dwelling on.
Two incidents, two different failures
In our analysis of the 5 August 2025 incident, Base's status page reported halted block production, but the chain was in fact still advancing at its normal pace. The blocks being produced were close to empty, carrying little beyond system transactions, so the accurate description was not downtime but a sharp drop in user-facing activity. Block height kept climbing; usable throughput did not. The lesson then was that a single status label, or a single coarse signal, can diverge from what is actually happening on-chain, and that the real impact was visible in activity metrics.
June 2026 is the other case. Block production did not continue in degraded form. It stopped. The chain did not advance for the duration of the outage.
What happened
Base relies on a single, centralised sequencer to order and produce blocks. During this incident the sequencer hit a state-handling fault: after a transaction error, internal execution state was not properly reset, and the next block was built on inconsistent state. The network's full nodes re-execute every block and rejected the inconsistent one, which stopped the chain at that height. A separate problem in the recovery path slowed the restart and produced a brief repeat the following day.
It is worth being precise about the role centralisation played, because the simple version of this story is wrong. The fault was deterministic: any producer running the same client software, given the same inputs, would have built the same block the network rejected. Ordinary redundancy does not help here; a second sequencer running identical software would reproduce the fault rather than absorb it. Only a genuinely independent implementation, built on a different codebase that does not share the bug, could in principle keep producing through a fault like this, and that kind of client diversity is not a feature of single-sequencer L2s today. What the single-producer design does determine is the blast radius: with one production path and no independent one already running, a fault that stops that path stops the whole network rather than being contained. Centralisation did not create the bug. It set how far the consequences reached.
User funds were not at risk, the L2 state was preserved, and settlement to Ethereum underneath was unaffected. This was a liveness failure, not a safety failure. That distinction matters, but it does not make a two-hour stall harmless. For an institution, the cost of a halt is measured in time-bound obligations that cannot be met while the chain is frozen: a settlement that cannot complete inside its window, collateral that cannot be posted before a position moves against you, a redemption that cannot be honoured on demand. Nothing is lost on-chain, but exposures held at the moment production stopped cannot be managed until it resumes.
How the incident looked across Metrika's KRIs
A single uptime figure is never the whole picture, which is why the platform tracks a layered set of Key Risk Indicators. Several of them captured this incident from different angles.
Network Uptime registered the outage directly, dropping to zero for the duration before recovering.
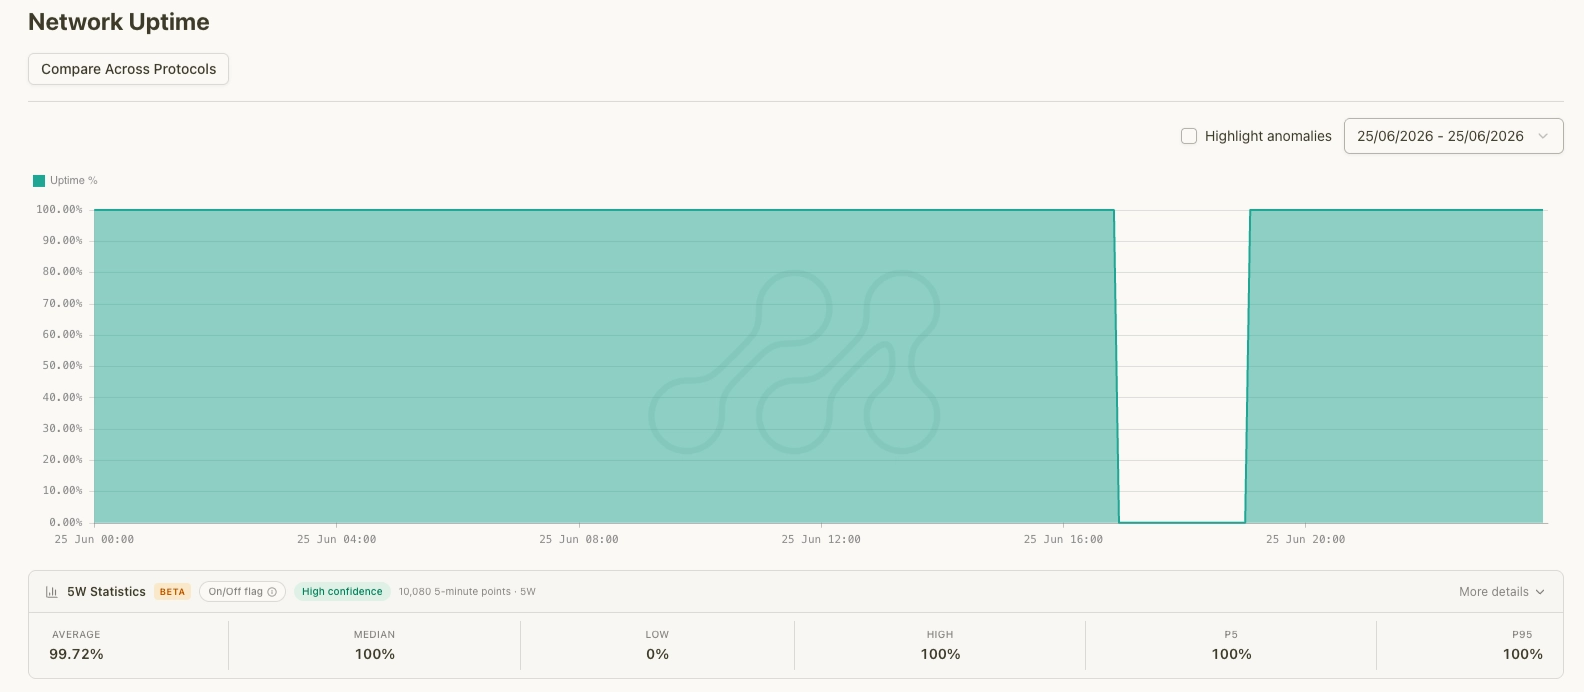
Uptime drops to 0% during the outage window, then recovers. Source: Metrika Platform (UTC+1).]
The brief recurrence the next afternoon shows up as a second, shorter dip.
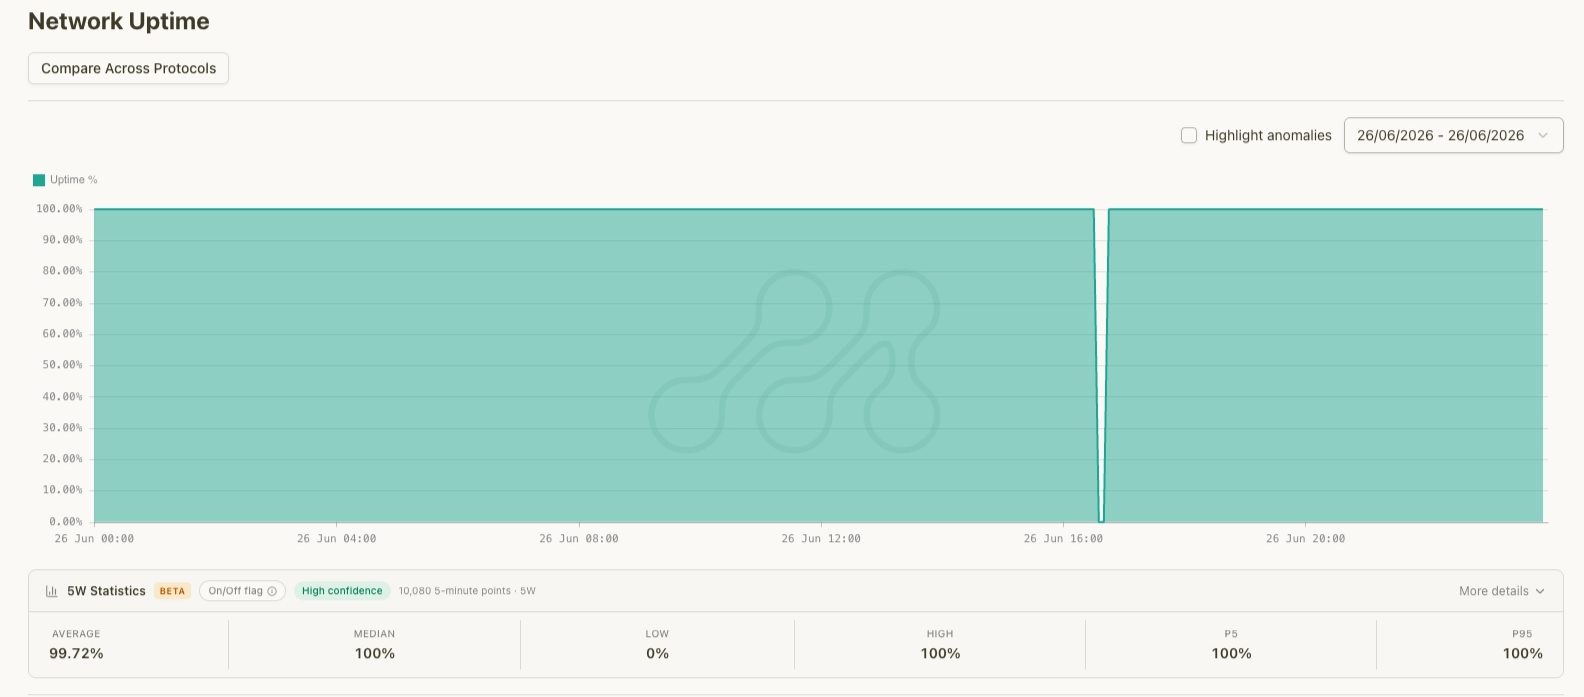
Short secondary dip. Source: Metrika Platform (UTC+1).
Major Incidents – Downtime, a purpose-built flag for outages exceeding an hour, stepped from zero to one as the halt crossed that threshold and held there.
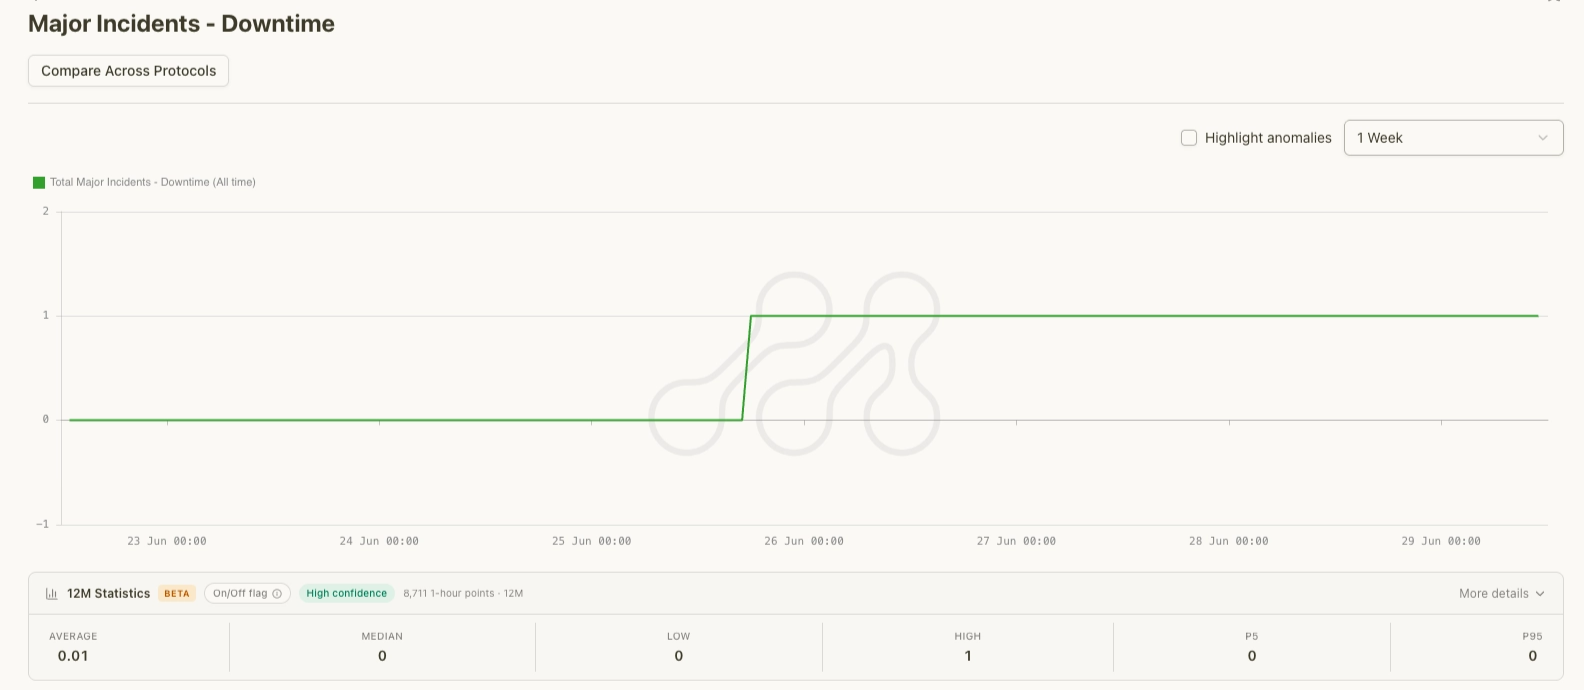
Steps 0 → 1 during the outage. Source: Metrika Platform (UTC+1).
Base Fee per Gas spiked around the incident, as demand for inclusion concentrated into the blocks immediately surrounding the disruption.
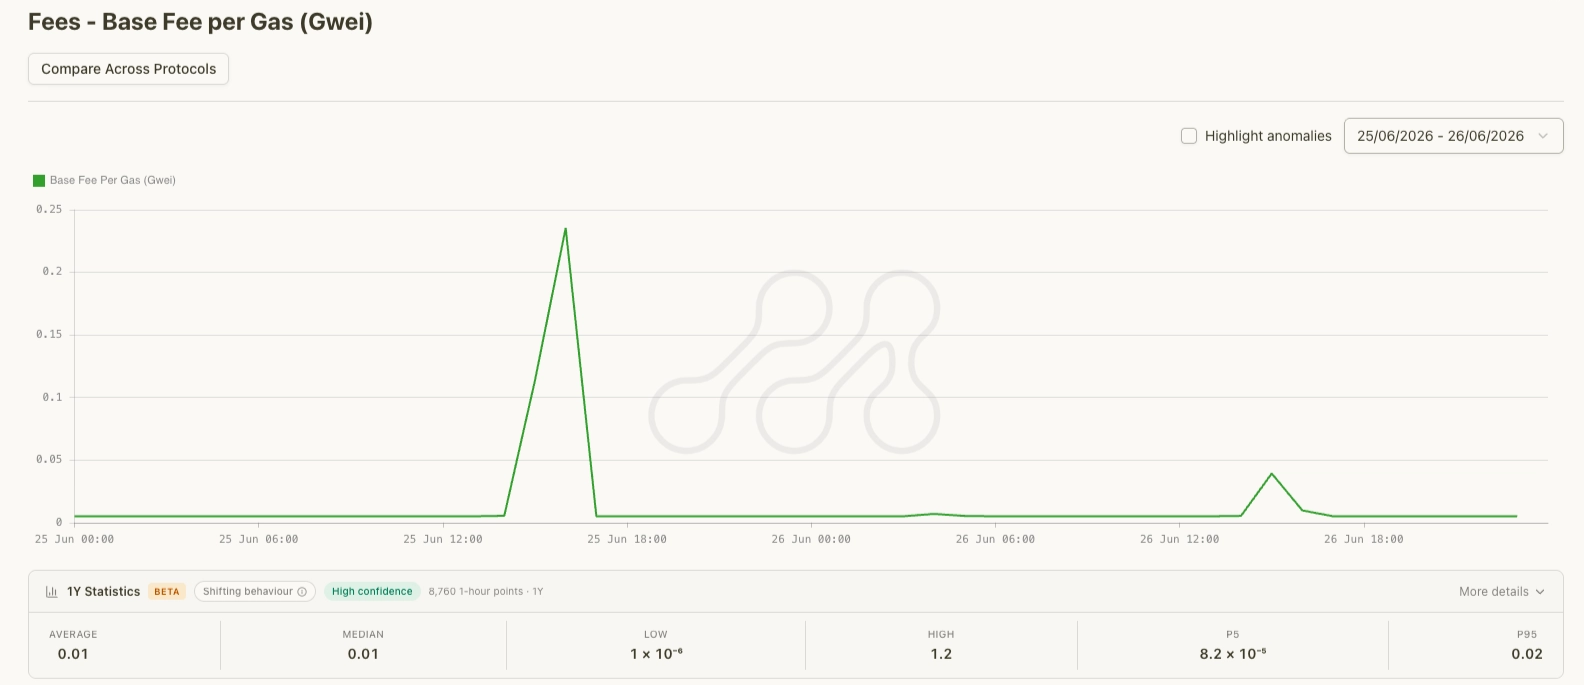
Pronounced spike around the outage window. Source: Metrika Platform (UTC+1).
Read together, these indicators describe both the outage itself and its knock-on effect on the fee market, which is exactly the kind of multi-dimensional view that a binary uptime light cannot provide.
Why a single uptime signal is not enough
The through-line across both Base incidents is that a coarse uptime reading can mislead both ways. In August, the status indicator suggested an outage while the chain was still producing, which would lead a naive reading to overstate the disruption. In June the chain genuinely stopped, and a check that only asks whether things look broadly normal could just as easily understate it. The failure modes are opposite; the weakness of a single coarse signal is the same. What holds up in both cases is watching the network's actual behaviour across several indicators at once, and treating both a slowdown and a full stop as the distinct events they are.
The broader picture
Two Base liveness incidents within a year, on a single-sequencer architecture, is worth noting even though the underlying faults differed: August stemmed from a failover that could not complete during a load spike, June from a state-handling error on the sequencer itself. A single-producer design concentrates the network's liveness on one component, which makes the monitoring around that component central to managing the risk. The architecture is a deliberate engineering trade-off, not a defect. The point for institutions building on L2s is that the resulting liveness risk is real, and it is monitorable with the right instrumentation.